
David McMillan
Crypto-enthusiast who explores all the possibilities the blockchain technology suggests
Most Popular Bearish Patterns in Trading
Table of Contents
There are many different concepts in crypto trading that may seem difficult to understand at first. Have you ever wondered what bearish patterns are and why traders always look for them closely? In this article, we answer these questions, giving examples of the most popular patterns and methods for using them.
What Is a Bearish Pattern in Trading?
A bearish pattern is a candlestick pattern on a chart showing that selling pressure is growing and the price is likely to reverse downward or continue to fall. These patterns usually appear after a rise and signal that buyers are losing strength and sellers are beginning to control the market. Simply put, a bearish pattern is a visual warning of a possible decline that helps traders understand in advance when it's better to sell, open a short position, or take profits to avoid losses when the market falls.
List of Most Popular Bearish Patterns
In crypto trading, there are many bearish patterns used for market analysis. We've gathered a top 5 of the most common and frequently used ones:
-
Bearish Engulfing;
-
Evening Star;
-
Dark Cloud Cover;
-
Shooting Star;
-
Three Black Crows.
Next, we will examine each of them separately so that you can better understand what these patterns represent.
Bearish Engulfing
A bearish engulfing is a candlestick reversal pattern that appears after an uptrend. It indicates that sellers have completely taken control from buyers. The pattern consists of two candlesticks: a small bullish one followed by a large bearish one that completely covers the body of the first candlestick. Such a sharp transition from buying to selling indicates a change in market sentiment.
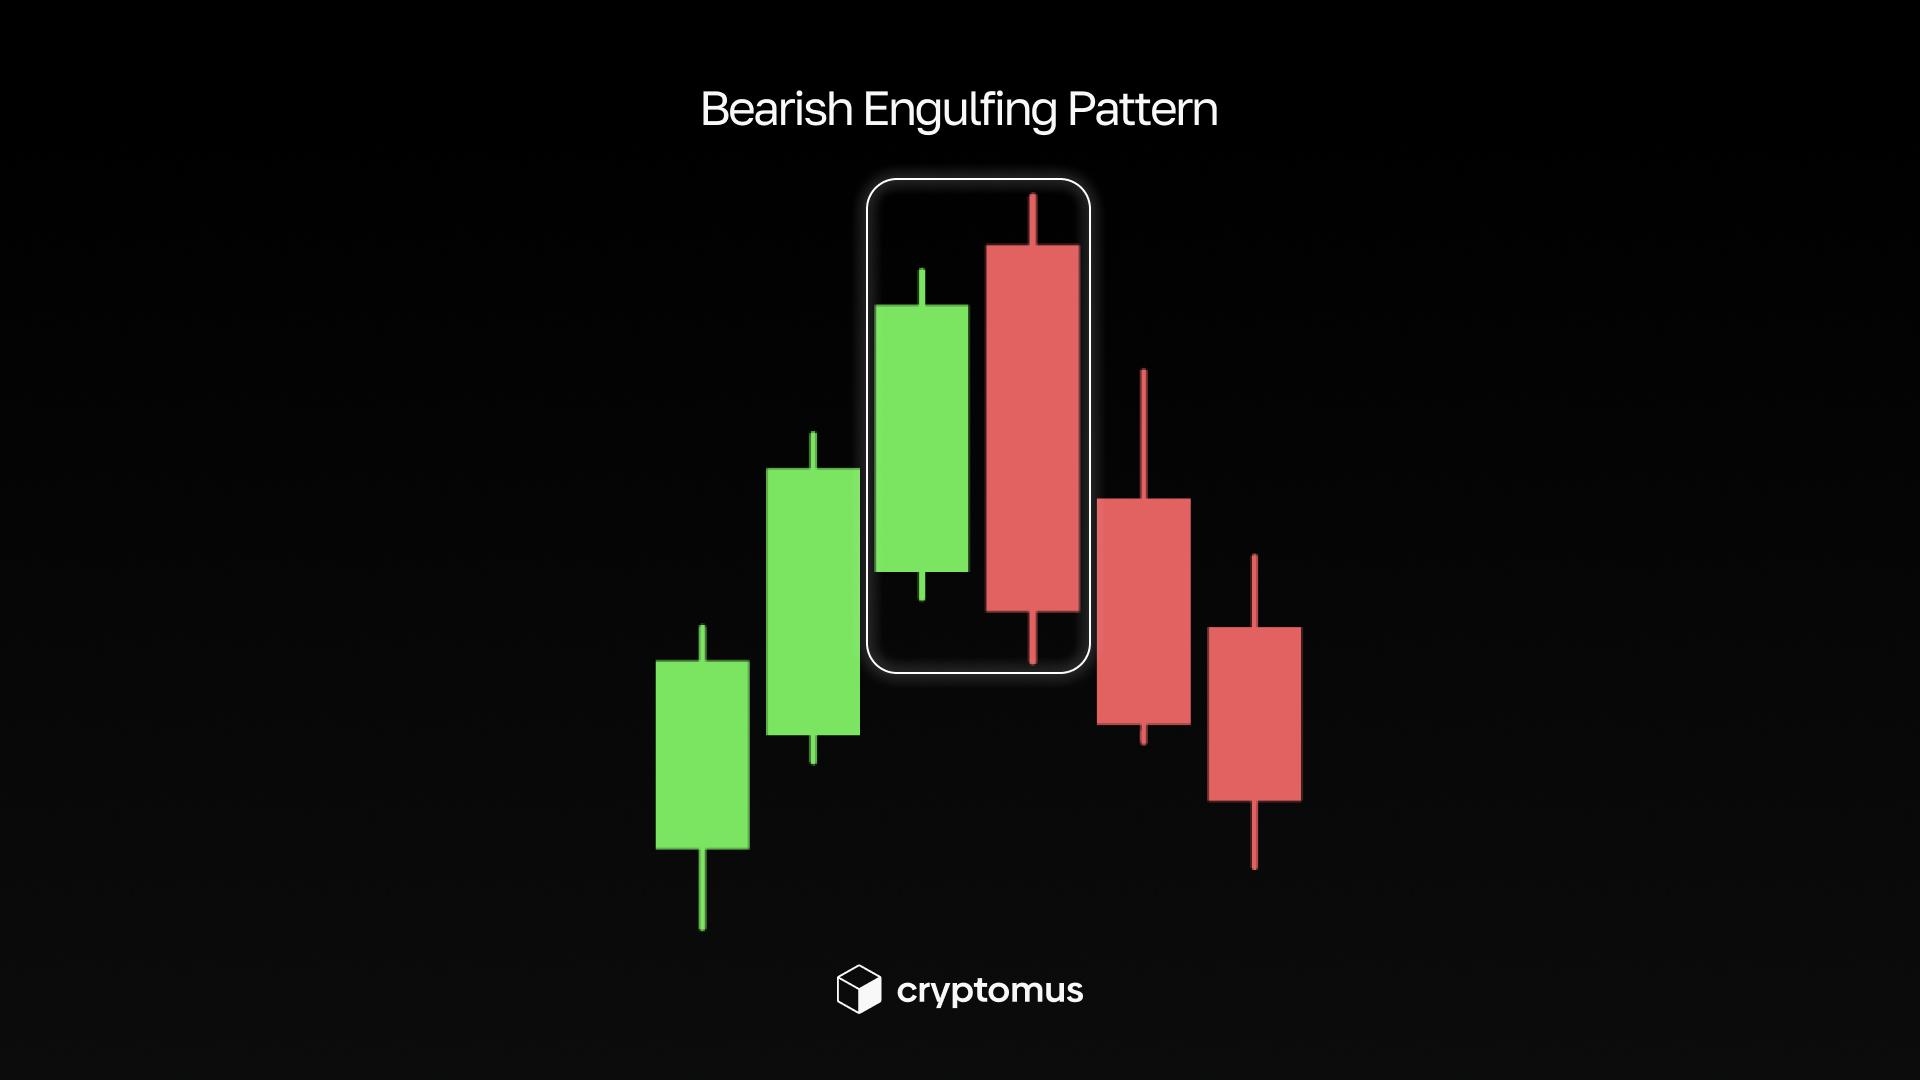
Traders see bearish engulfing as a warning that the uptrend is weakening and a decline may begin. After the engulfing appears, many consider the possibility of selling, taking profits, or opening short positions.
Evening Star
The evening star is a bearish reversal pattern of three candlesticks that appears after an uptrend. It indicates that the upward momentum is losing strength. First, a large bullish candlestick forms, followed by a small candlestick of uncertainty, and then a large bearish candlestick that closes below the middle of the first one. This sequence indicates a transition from confident buying to weakness and then to clear selling pressure.
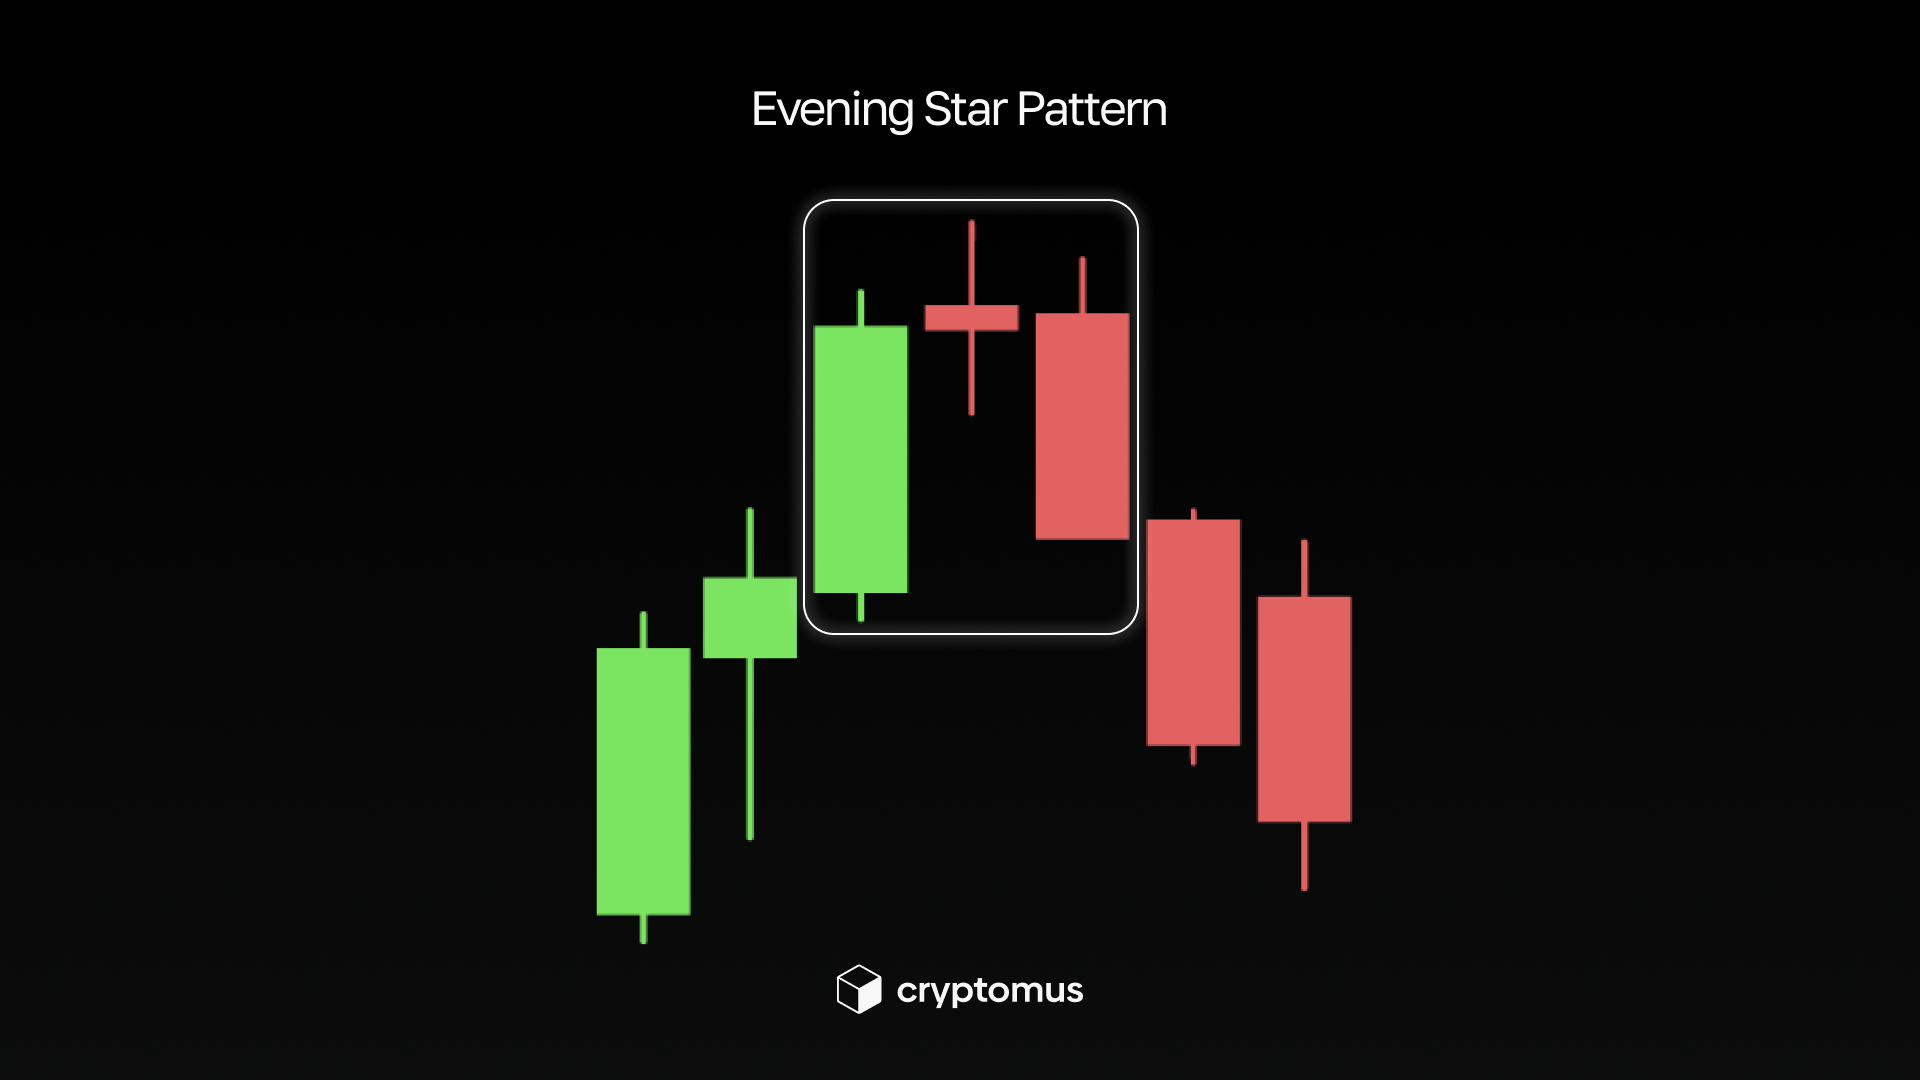
Traders see the evening star as a signal that the market may turn down. The pattern is even stronger if it forms at a resistance level or is accompanied by an increased volume. After its appearance, many prepare for a decline: they take profits, reduce positions, or consider entering short positions.
Dark Cloud Cover
A dark cloud is a two-candlestick bearish reversal pattern: a large bullish candlestick followed by a bearish one that opens above the previous close but closes below the middle of the first candlestick's body. This movement indicates that the market attempted to continue its growth, but sellers quickly took control and pushed the price down.
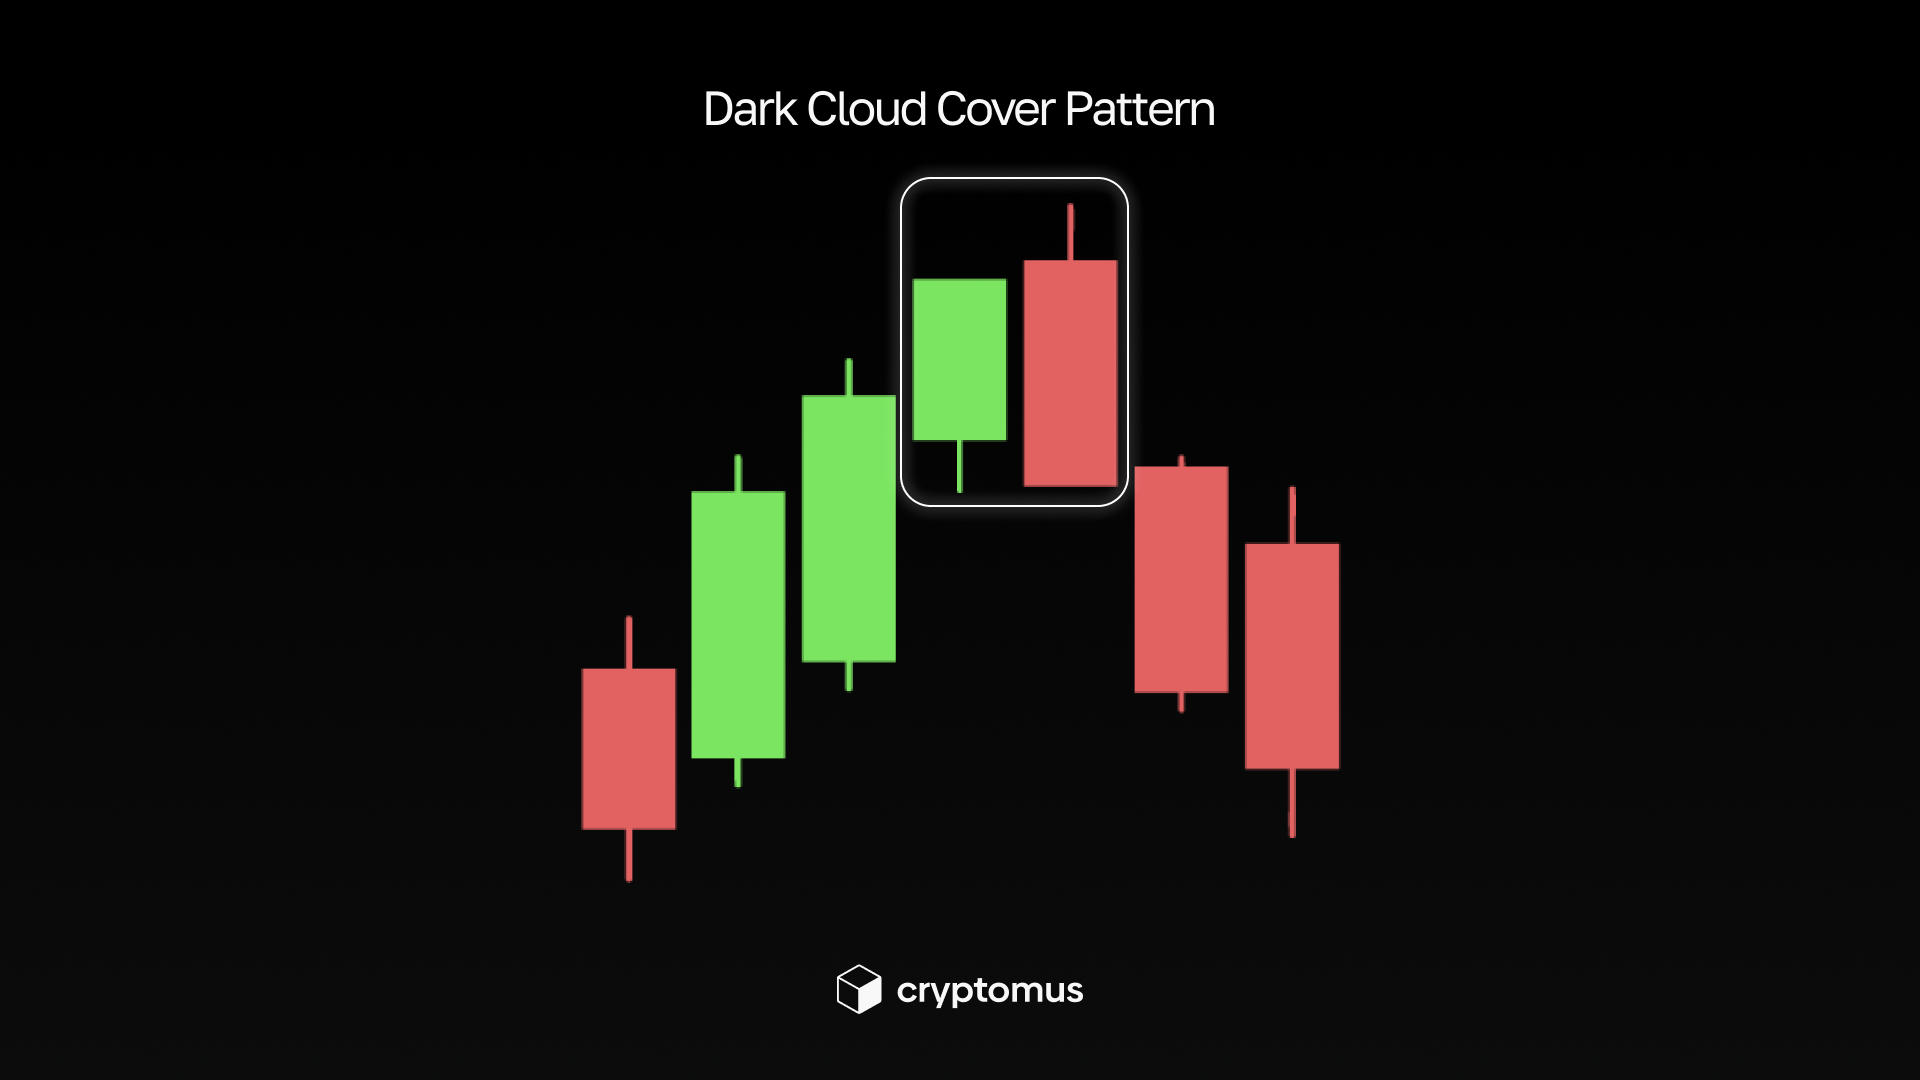
For traders, a dark cloud serves as a warning of a likely downturn. After its appearance, traders often consider taking profits, reducing long positions, or looking for a point to enter a short position.
Shooting Star
A shooting star is a single-candlestick bearish pattern. It has a small body at the bottom of the range and a long upper shadow, which means that the price rose sharply, but sellers were able to bring it back to almost the opening level. Such a sharp pullback shows the weakness of the bulls and increased pressure from sellers.
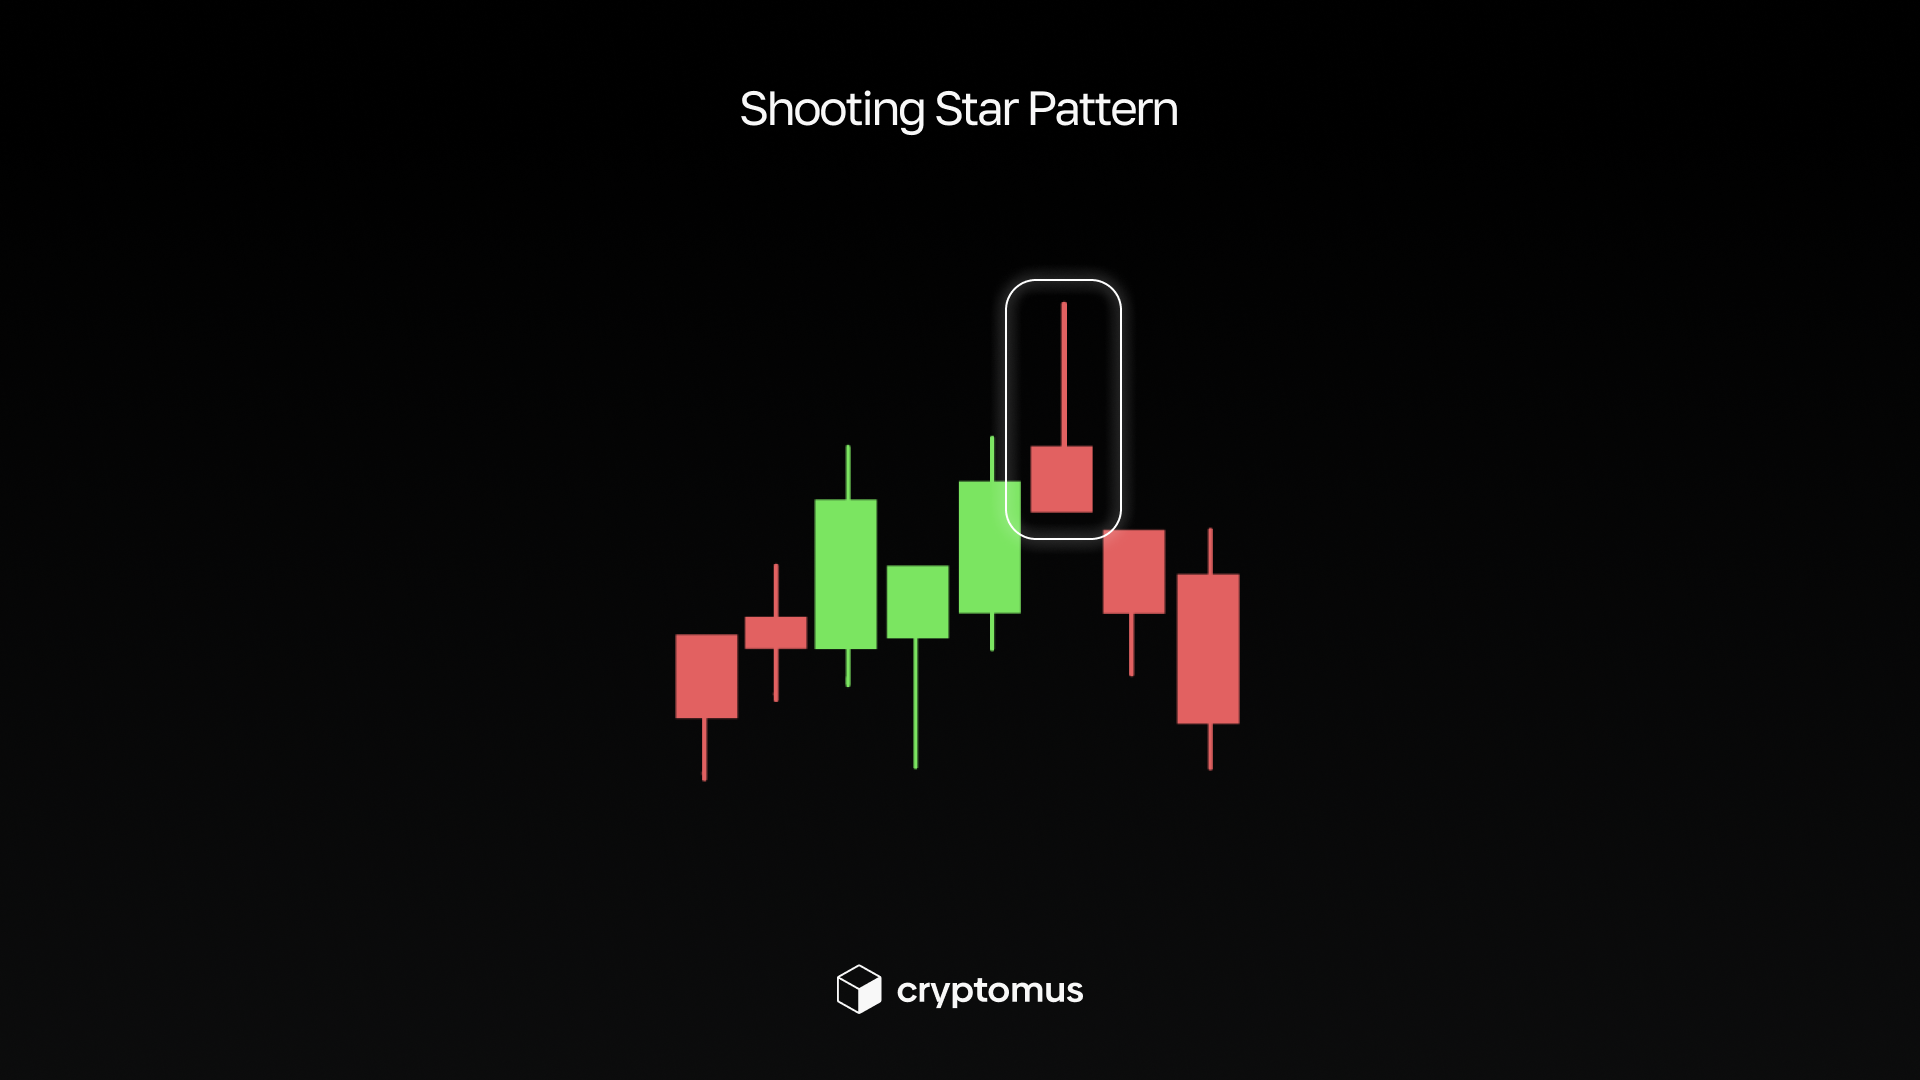
For traders, a shooting star is a signal of a possible downward reversal. The pattern is considered more reliable if it appears at the resistance level or after a sharp rise. Traders usually wait for confirmation from the next candlestick, which should close below the body of the shooting star. After that, many consider taking profits or opening short positions, expecting a further decline.
Three Black Crows
Three black crows is a strong bearish pattern consisting of three consecutive long red candles, each of which opens inside the body of the previous one and closes below its low. This sequence shows sustained and growing pressure from sellers: buyers are no longer able to drive growth, and the market is gradually shifting downward without any significant attempts at a rebound.
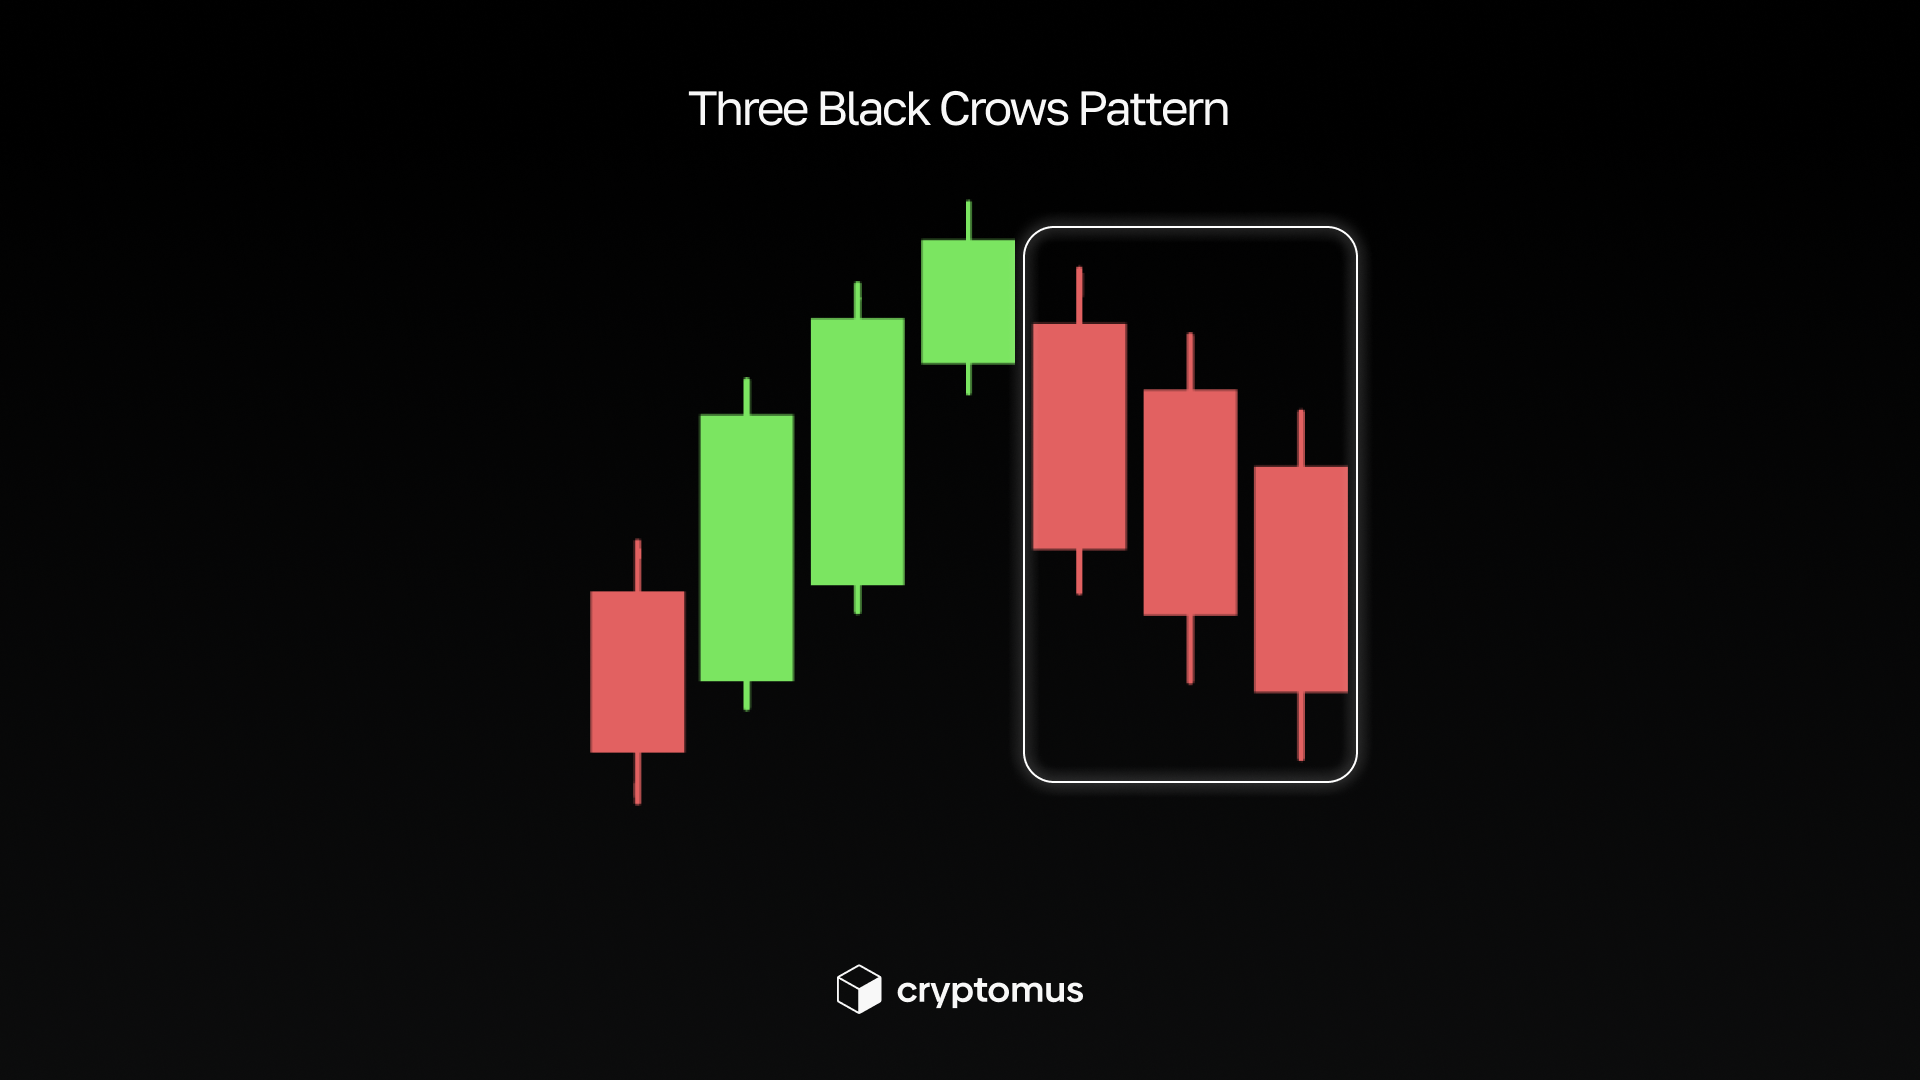
For traders, this pattern is a clear signal that the uptrend is over and a full-fledged decline is beginning. Its reliability increases if it forms after a long period of growth or at a strong resistance zone. After the appearance of three black crows, many traders prepare for the decline to continue: they close long positions, consider short positions, or wait for further confirmation of the bearish trend.
How to Use Bearish Patterns in Trading?
Bearish patterns help traders understand where the market is heading. They are used for the following purposes:
-
Determining the entry or exit point. Bearish patterns indicate where the market may stop growing and turn downward. If such a pattern appears after an upward movement and near the resistance level, it often becomes a convenient point for selling or opening a short position.
-
Confirming the start of a decline. Before taking action, it's important to wait for confirmation—for example, the next red candle or an increase in sales volumes. This shows that sellers are really entering the game, and the reversal signal is not accidental.
-
Using short positions. Bearish patterns help traders open short positions, which allow profiting when the price goes down. After confirming the downward trend, traders can enter a short position, expecting the price to keep declining. The sharper and clearer the pattern, the better the potential for profit on the downside movement.

-
Setting stop losses. After a bearish pattern forms, traders usually place a stop loss just above the nearest high. This helps limit losses if the market unexpectedly continues to rise.
-
Assessing the overall trend. Bearish patterns become more reliable when the overall market does not contradict them. If the global trend is downward, such signals give a higher probability of a successful trade.
-
Combination with indicators. Indicators such as RSI, MACD, or trading volume help determine whether sellers are really gaining strength. If both the pattern and the indicators point downwards, the signal becomes much stronger.

So, bearish patterns are not direct commands like “Sell now!” but visual cues that reflect the weakness of buyers and the increasing pressure from sellers. The ability to recognize such patterns and confirm them with additional analysis allows traders to prepare in advance for a price decline and make more informed decisions.
What other bearish patterns do you know? Have you ever used them? If so, when and how? Let's discuss it!


Simplify Your Crypto Journey
Want to store, send, accept, stake, or trade cryptocurrencies? With Cryptomus it's all possible — sign up and manage your cryptocurrency funds with our handy tools.
Get Started