
David McMillan
Crypto-enthusiast who explores all the possibilities the blockchain technology suggests
What is the Cup and Handle Pattern, and How Do You Use It in Trading?
Table of Contents
If you are even slightly interested in crypto charts, you have probably heard of the “сup with handle” pattern—one of the most recognizable price movement patterns. It provides clear logic: the asset forms a base (cup) for a long time, then takes a short break (handle), and when it breaks through, it goes into momentum.
In today's article, we will tell you in detail about this pattern, how to recognize it, and how to use it in trading.
What Is the Cup and Handle Pattern?
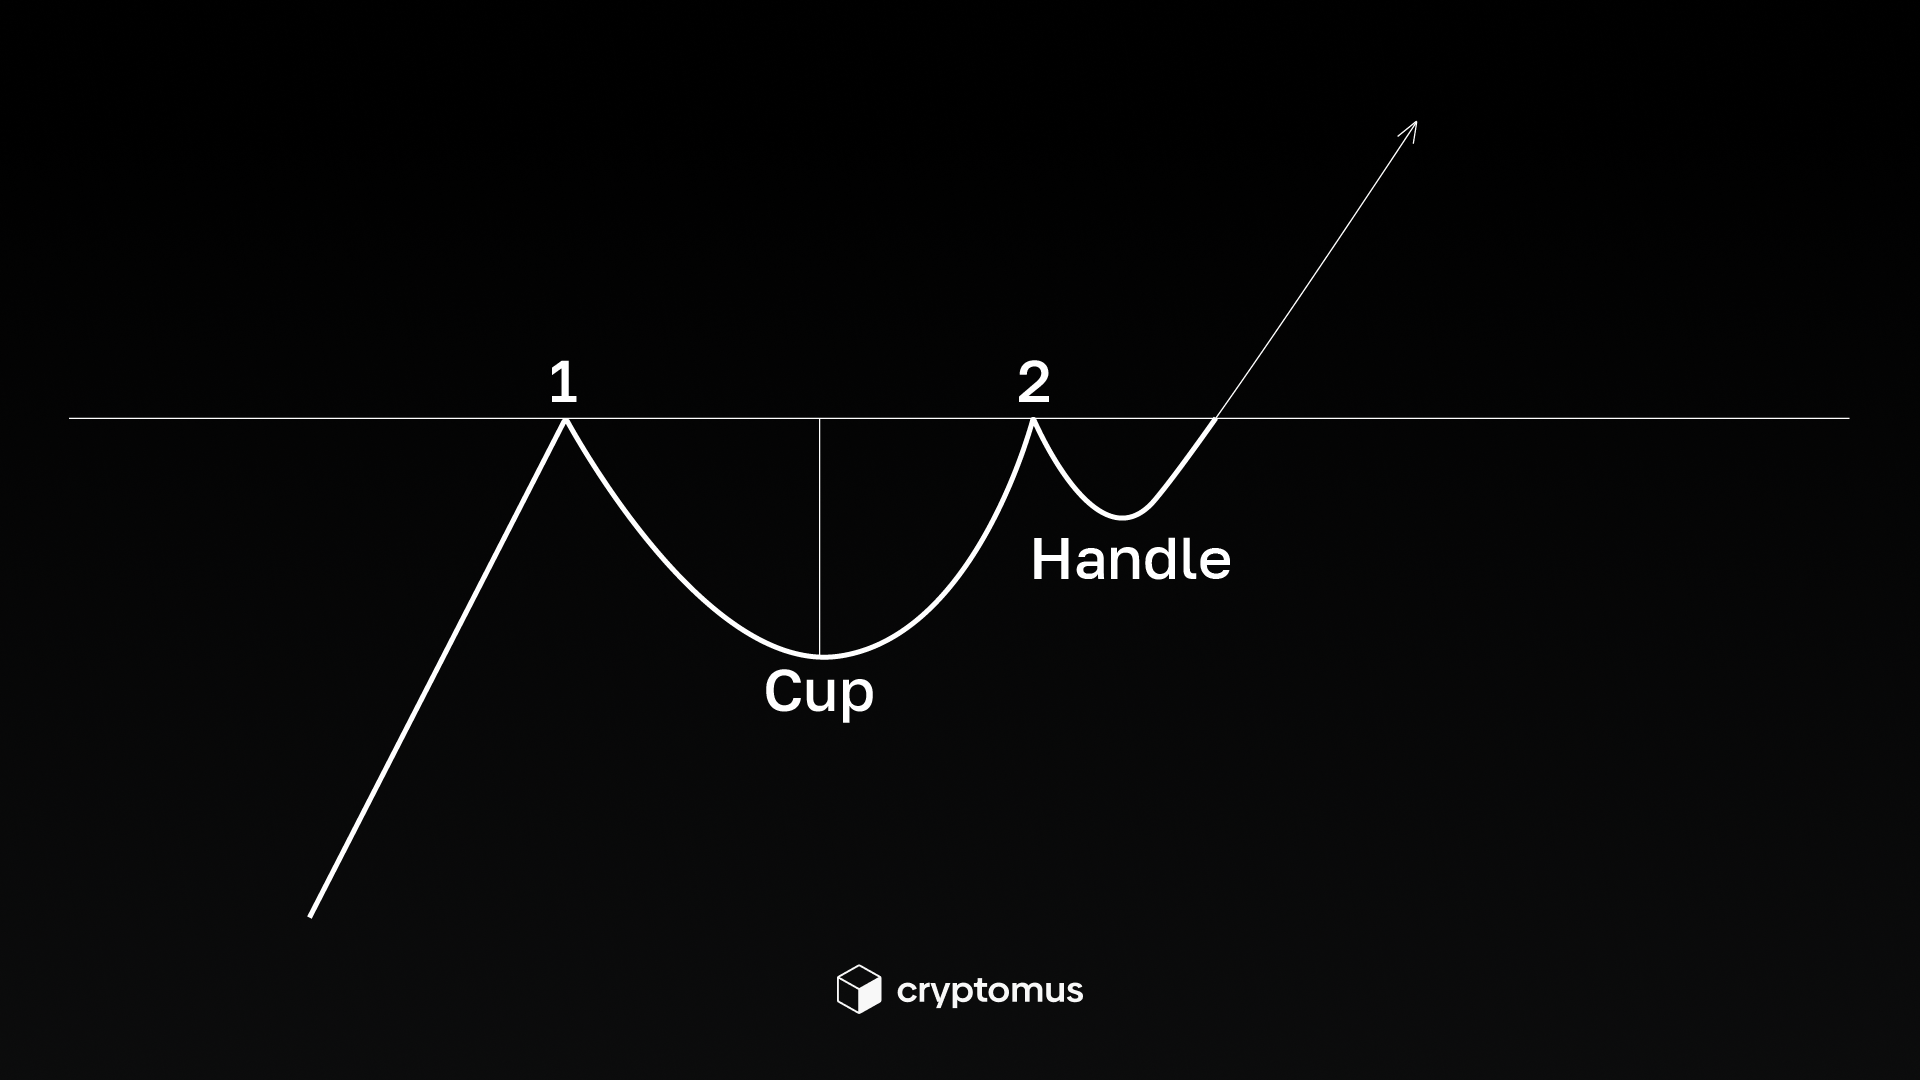
A cup and handle is a bullish continuation or reversal pattern popularized by William O'Neil. In classic terms, it appears after an upward movement, when the market enters a broad, smooth correction, forming a U-shaped “cup”. This is followed by a compact consolidation closer to the upper edge—the “handle”. A breakout of the resistance level at the top of the handle is accompanied by an increase in volume and triggers a new impulse.
The key idea lies in the psychology of the participants, as each part of the pattern represents a mood. Let's take a closer look: the left wall of the cup represents a shift away from bullish sentiment and profit-taking. The bottom of the cup is defined as “fatigue” on the part of sellers and price stabilization. The right wall of the cup is interpreted as a neat return of demand. The “handle” is the final test of strength: the weak exit, while the strong participants accumulate. A breakout shows that the balance of power has shifted in favor of buyers.
How to Identify the Cup and Handle Pattern?
To avoid seeing cups everywhere, keep in mind several objective criteria for recognizing the pattern:
-
Cup shape: the pattern should be U-shaped, not V-shaped. The market should “exhale” and stabilize because the sharper the rebound, the higher the risk of a false breakout——the price may not go up, but fluctuate at the levels reached or even go down. As a rule, cups with a longer, U-shaped bottom provide a stronger signal.
-
Depth: ideally, the cup should not be too deep. For moderately volatile assets, a normal cup depth is approximately 12-33% of the previous high, but a depth of more than ~50-60% already signals a potential irreversible decline in the asset's price.
-
Volume: as the handle forms, fluctuations usually narrow, volume “dries up”, and expands on a breakout. Such volatility is a sign of accumulation.
-
Trend context: the best cups appear in rising or at least neutral markets. In a pronounced downtrend, the probability of a false breakout is higher.

How to Use the Cup and Handle Pattern in Trading?
The practical application of the “cup with handle” pattern is based on a simple plan. The trigger is a breakout of the upper boundary of the “handle”: it is safer to wait for the candle to close above this level, and even better—for confirmation by volume. There is also a conservative approach; it allows the price to return to the broken resistance and look for an entry point on the retest. Aggressive traders sometimes open a position while still inside the “handle”, when exiting a local narrowing of the range, but such a move requires additional confirmation—for example, a narrowing of volatility and a clear surge in volume on the upswing.
Position protection is formed in advance. The basic stop loss is usually placed below the minimum of the “handle”, i.e., where the structure loses its meaning. Many use a close below the middle of the ‘cup’ as a “red line”: such a movement often indicates that the model is declining and the probability of continuation is decreasing.
The target setting in this pattern is transparent: the classic target is the height of the “cup”, deferred upward from the breakout point. In practice, it is convenient to break the exit into several stages—fix part of the position when half of the target is reached, bring the rest to the full “height”, moving the trade to break-even, and pull up the stop according to ATR. This approach smooths out the psychological pressure and helps to survive the inevitable pullbacks on the way to the target.
Like any technical tool, the “cup with handle” should not be used alone but in combination with other signals and basic risk management rules.

Pros and Cons of the Cup and Handle Pattern
This pattern has its strengths and weaknesses. Let's take a closer look at them.
| Aspect | Characteristics | |
|---|---|---|
| Pros | Clear logic and rules: clear trigger (breakout of the handle), clear stop (below the handle), measurable target (height of the cup). This simplifies systematization and backtesting. Good risk/reward ratio: even with partial exits, this pattern can be profitable. Synergy with volumes: a handle and a surge in volume at the breakout increase the chance of continuation. | |
| Cons | Difficult for beginners: some traders see a cup in any sideways movement. Strictly adhere to the criteria of shape, depth, and handle location. Duration of formation: on higher timeframes, the model can mature for weeks. This is a test of discipline. Weak on its own: it needs to be used in combination with other charts and indicators. |
So, “Cup and Handle” is an excellent pattern for preparing the ground for a breakout and momentum. In crypto, it requires greater caution: respect the stop under the handle, wait for confirmation by volume, and don't overestimate cups that are too deep.
Was this article helpful to you? Let us know in the comments.


Simplify Your Crypto Journey
Want to store, send, accept, stake, or trade cryptocurrencies? With Cryptomus it's all possible — sign up and manage your cryptocurrency funds with our handy tools.
Get Started