Logan Brooks
Crypto expert explaining blockchain technologies in a clear and accessible way.
What Is Golden Cross Pattern In Trading?
Table of Contents
There are many graphical signals in technical analysis that help traders make decisions — one of them is the Golden Cross pattern. Many traders see it as a strong sign that the market could start moving up, and it’s commonly used in both traditional finance and crypto.
In this article, we will analyze what the Golden Cross is in simple terms, how it is formed, what it can mean for a trader and how well it works in practice.
What Does A Golden Cross Indicate?
Golden Cross in crypto trading is one of the most well-known bullish signals. This happens when the recent average price (like the 50-day) climbs above the long-term average (like the 200-day). Some see it as an early sign that the market is gaining strength again and may be shifting into a more positive trend.
Moving averages make it easier to spot the overall trend by filtering out short-term price swings. When the line representing recent prices rises above the longer-term line, it can indicate that buyers are gaining strength and momentum is shifting upward.
The Golden Cross is usually seen as a signal for medium- to long-term growth — from several weeks to a few months. Like any indicator, it’s most reliable when used alongside others such as trading volume, RSI, MACD, or support and resistance levels.
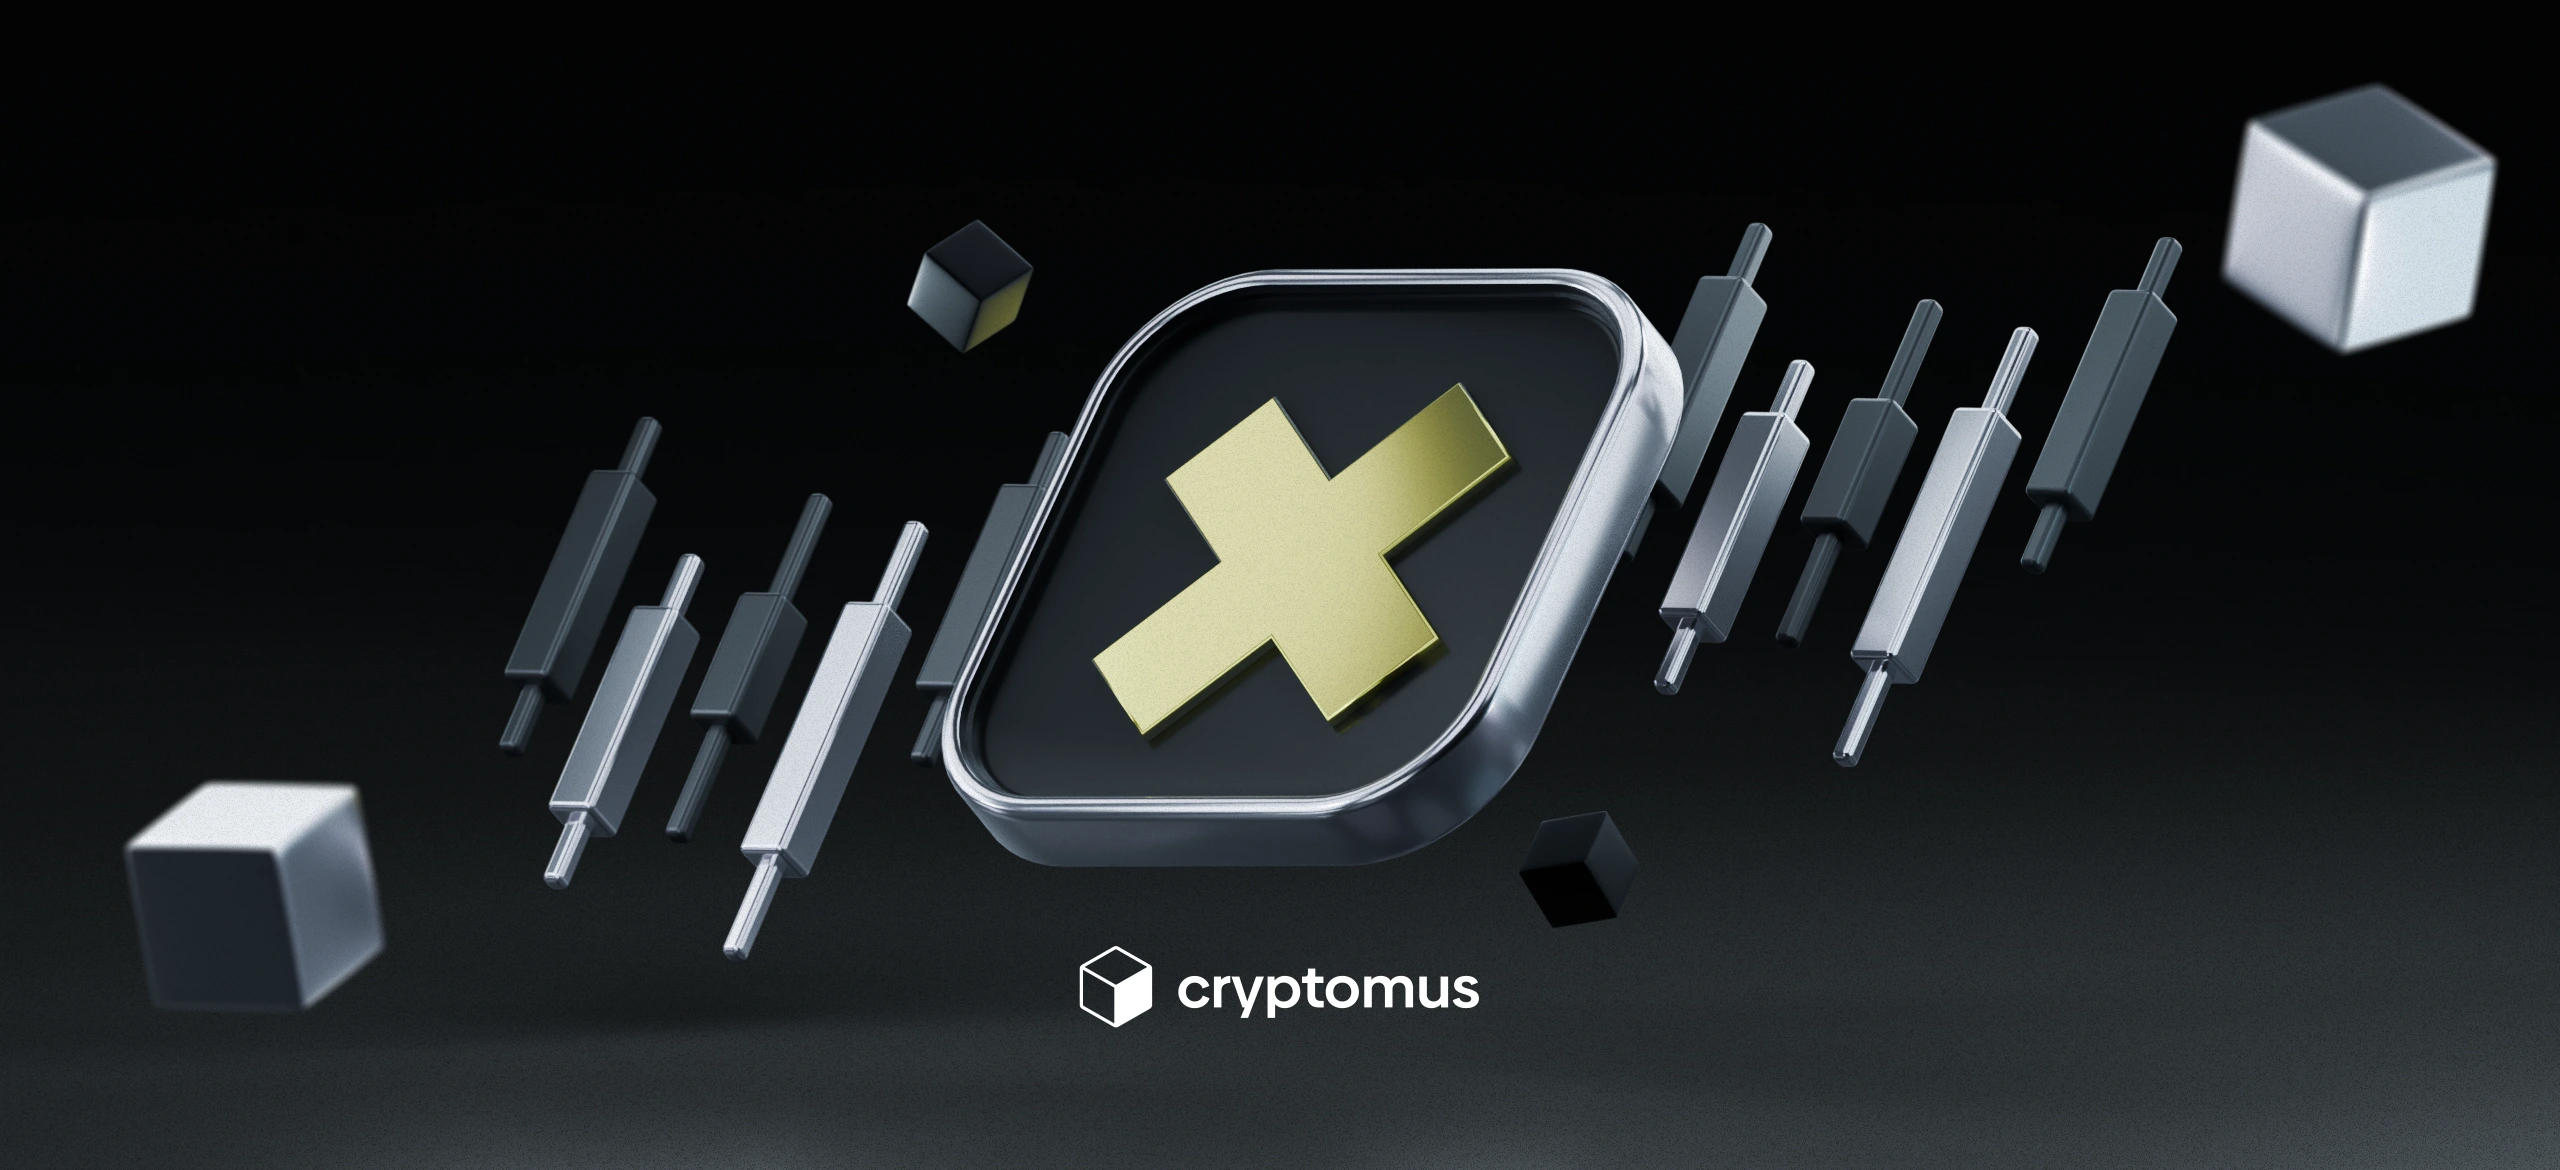
What Does A Golden Cross Look Like?
You’ll spot a Golden Cross on the chart when two moving averages cross — the shorter one, like the 50-day, curves upward and crosses above the longer one, such as the 200-day. Since these lines are drawn over the price candles, the crossover is usually easy to see.
The short-term average reacts quickly to price shifts, while the long-term one changes more slowly and steadily. When the quicker line rises and crosses above the slower one from below, it forms a shape that often looks like the letter “X”. Many also look at trading volume: if it goes up during the crossover, the signal is usually considered more reliable.
You can see an example of the Golden Cross on the chart below:
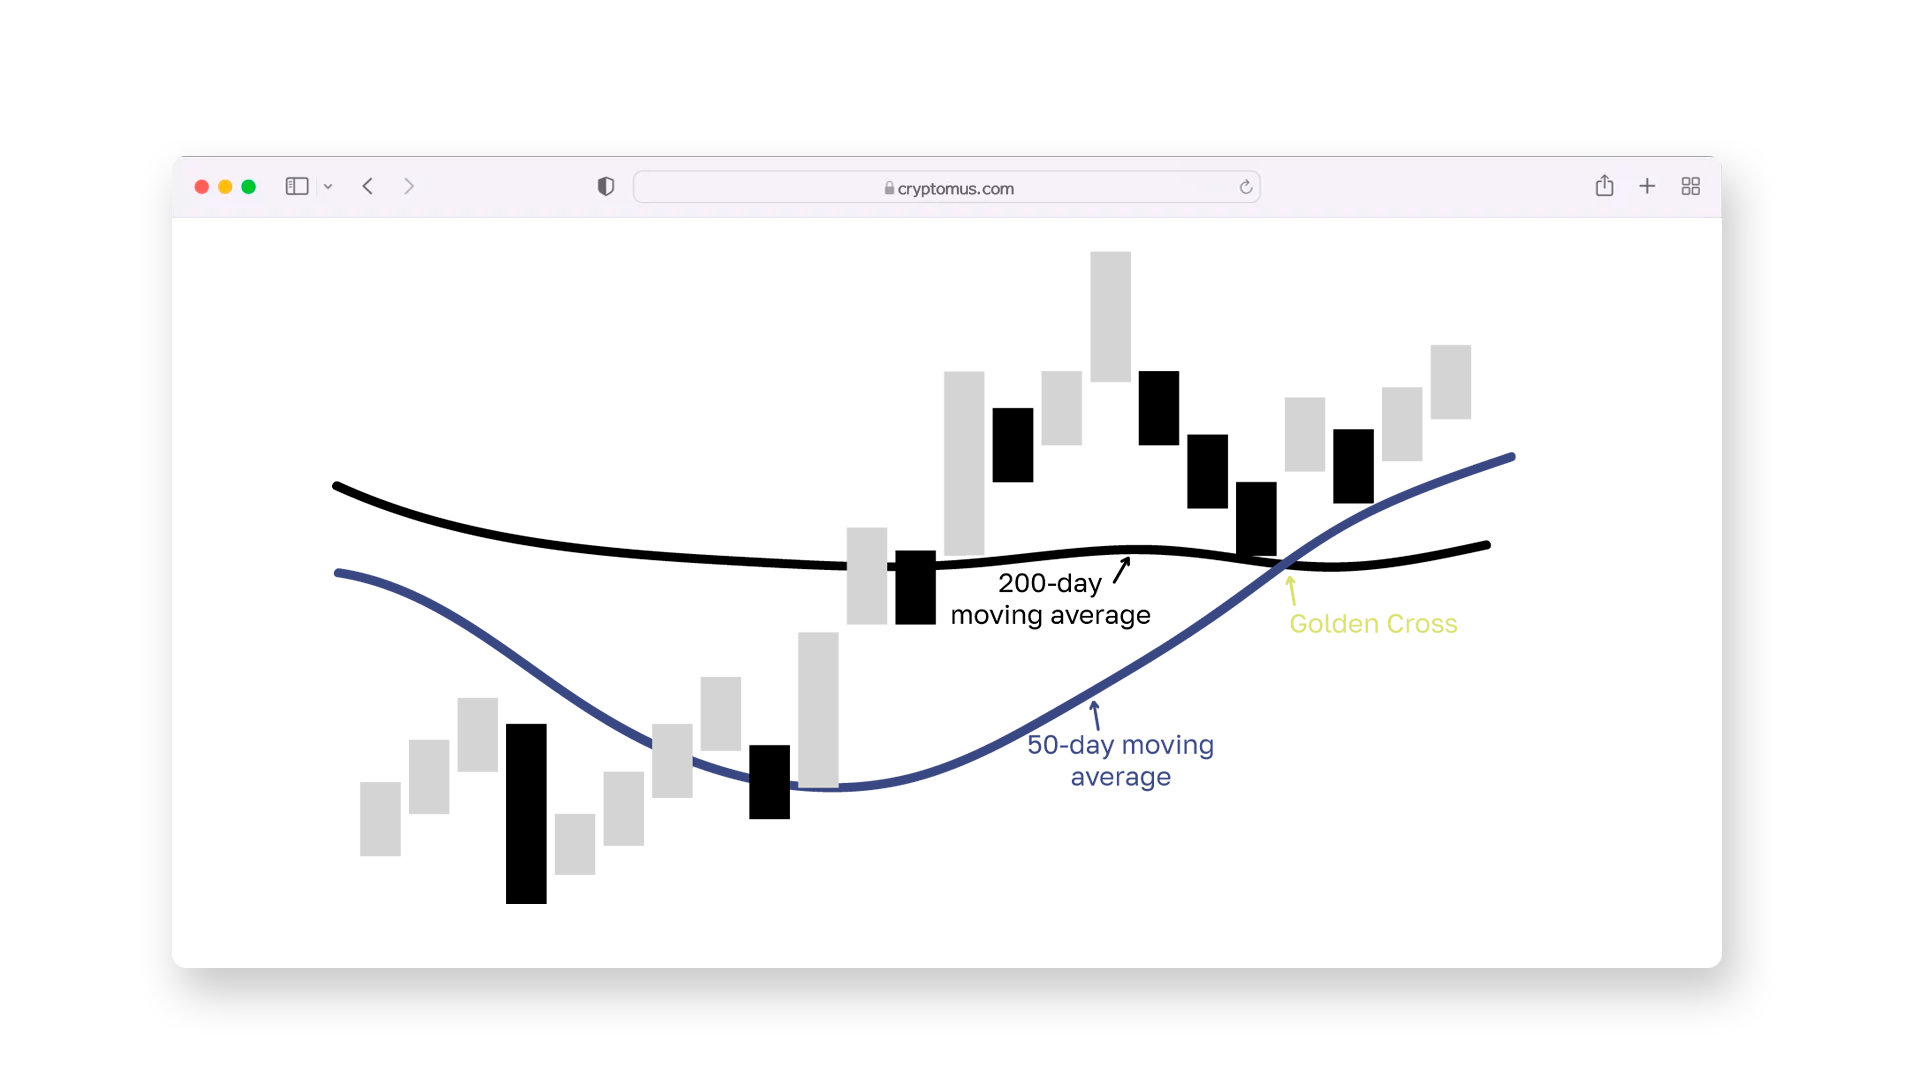
Example Of Golden Cross In Crypto Trading
Golden Cross, being a well-known chart pattern, doesn’t always result in a price rally. How well it works often depends on the bigger picture — like market sentiment. To see how the Golden Cross plays out in real crypto markets, let’s look at 2 examples.
Successful Case: Bitcoin In April 2019
A clear example of a Golden Cross appeared on Bitcoin’s chart in April 2019. After a long bear market in 2018, the 50-day moving average finally crossed above the 200-day, catching the attention of many traders.
This signal turned out to be accurate. Over the next few months, Bitcoin rose from about $5,000 to more than $13,000 — a gain of over 150%. For many traders, that Golden Cross marked the start of a fresh bullish trend.
This case shows that a Golden Cross can signal the beginning of a solid upward move — especially when it’s backed by strong trading volume and a positive shift in market mood.
Failed Case: Ethereum In January 2022
At the same time, a Golden Cross doesn’t always mean prices will rise. In early 2022, Ethereum also showed a Golden Cross on the daily chart. The short-term average moved above the long-term one, but instead of breaking higher, the price lost momentum and eventually dropped.
At the time, the overall market was facing a lot of pressure — rising interest rates and global uncertainty were weighing on risk assets. Because of that, the Golden Cross didn’t lead to a lasting rally.
In this case, the signal didn’t play out — the market didn’t have enough momentum, and the bullish pattern quickly lost strength.
Golden Cross can be a useful signal, particularly when the market is already showing signs of strength. Real examples show it’s not reliable on its own. That’s why many traders combine it with other tools — it’s always worth considering the broader market context before making a move.
How To Use Golden Cross Indicator In Trading?
Golden Cross is most useful when combined with a broader trading strategy — not used on its own. Here's how you can make the most of it:
- Wait for confirmation. Don’t rush in as soon as the lines cross. Some traders wait for a few days of upward movement or increased trading volume to confirm the trend is gaining strength.
- Use it on higher timeframes. The Golden Cross tends to give stronger signals on daily or weekly charts. On shorter timeframes, crossovers happen more often and can be less reliable.
- Combine with other indicators. Tools like RSI, MACD, and key support or resistance levels can help you figure out if the signal is really worth acting on. For instance, if the RSI also points to upward momentum, it gives the setup more weight.
- Set risk management rules. Even if the signal looks promising, markets can still turn the other way. That’s why setting a stop-loss or knowing your risk limit is key.
In short, Golden Cross works best when it's part of a bigger picture — not just a green light to buy without context.
Golden Cross Vs. Death Cross
The Golden Cross and Death Cross are opposites — one points to a possible upward trend, the other to a potential decline.
| Feature | Golden Cross | Death Cross | |
|---|---|---|---|
| What it means | Bullish signal (market may go up) | Bearish signal (market may go down) | |
| How it forms | 50-day MA crosses above 200-day MA | 50-day MA crosses below 200-day MA | |
| When it happens | After a downtrend, showing potential recovery | After an uptrend, signaling possible reversal | |
| Used by traders for | Identifying buying opportunities | Spotting when to sell or avoid long entries |
Spotting a Golden Cross on the chart is simple, but using it well takes context. It works best as part of a broader trading plan that includes other indicators and solid risk management. With experience, it can become a reliable piece of your overall strategy.
Thanks for reading!


Simplify Your Crypto Journey
Want to store, send, accept, stake, or trade cryptocurrencies? With Cryptomus it's all possible — sign up and manage your cryptocurrency funds with our handy tools.
Get Started