
David McMillan
Crypto-enthusiast who explores all the possibilities the blockchain technology suggests
What Are Falling and Rising Wedge Patterns in Trading
Table of Contents
Out of all the chart patterns in trading, the wedge pattern is one of the easiest to spot. Why? Because it looks just like it sounds—a chart in the form of a cone, wide on one side and narrow on the other. In this article, we’ll break down the falling and rising types you’ll come across, how to recognize them, and how to use them in trading. Let’s get into it!
What Is a Falling Wedge Pattern?
A falling wedge is a bullish chart pattern that appears when the price continues to fall but does so with decreasing momentum. You’ll notice both the highs and lows are getting lower, but the gap between them is shrinking. On the chart, the lines start to squeeze together. This usually signals that sellers are running out of steam, and buyers are quietly stepping in. Once the price breaks out above the upper line, it often kicks off a new upward trend.
What Is a Rising Wedge Pattern?
A rising wedge is a bearish pattern that shows up when prices are climbing, but the momentum is fading. The highs and lows are still rising, but they’re creeping closer together, forming a narrowing pattern. This suggests that buyers are losing power while sellers are getting stronger. When the price finally breaks below the lower line, it often leads to a downtrend.
How to Identify these Patterns?
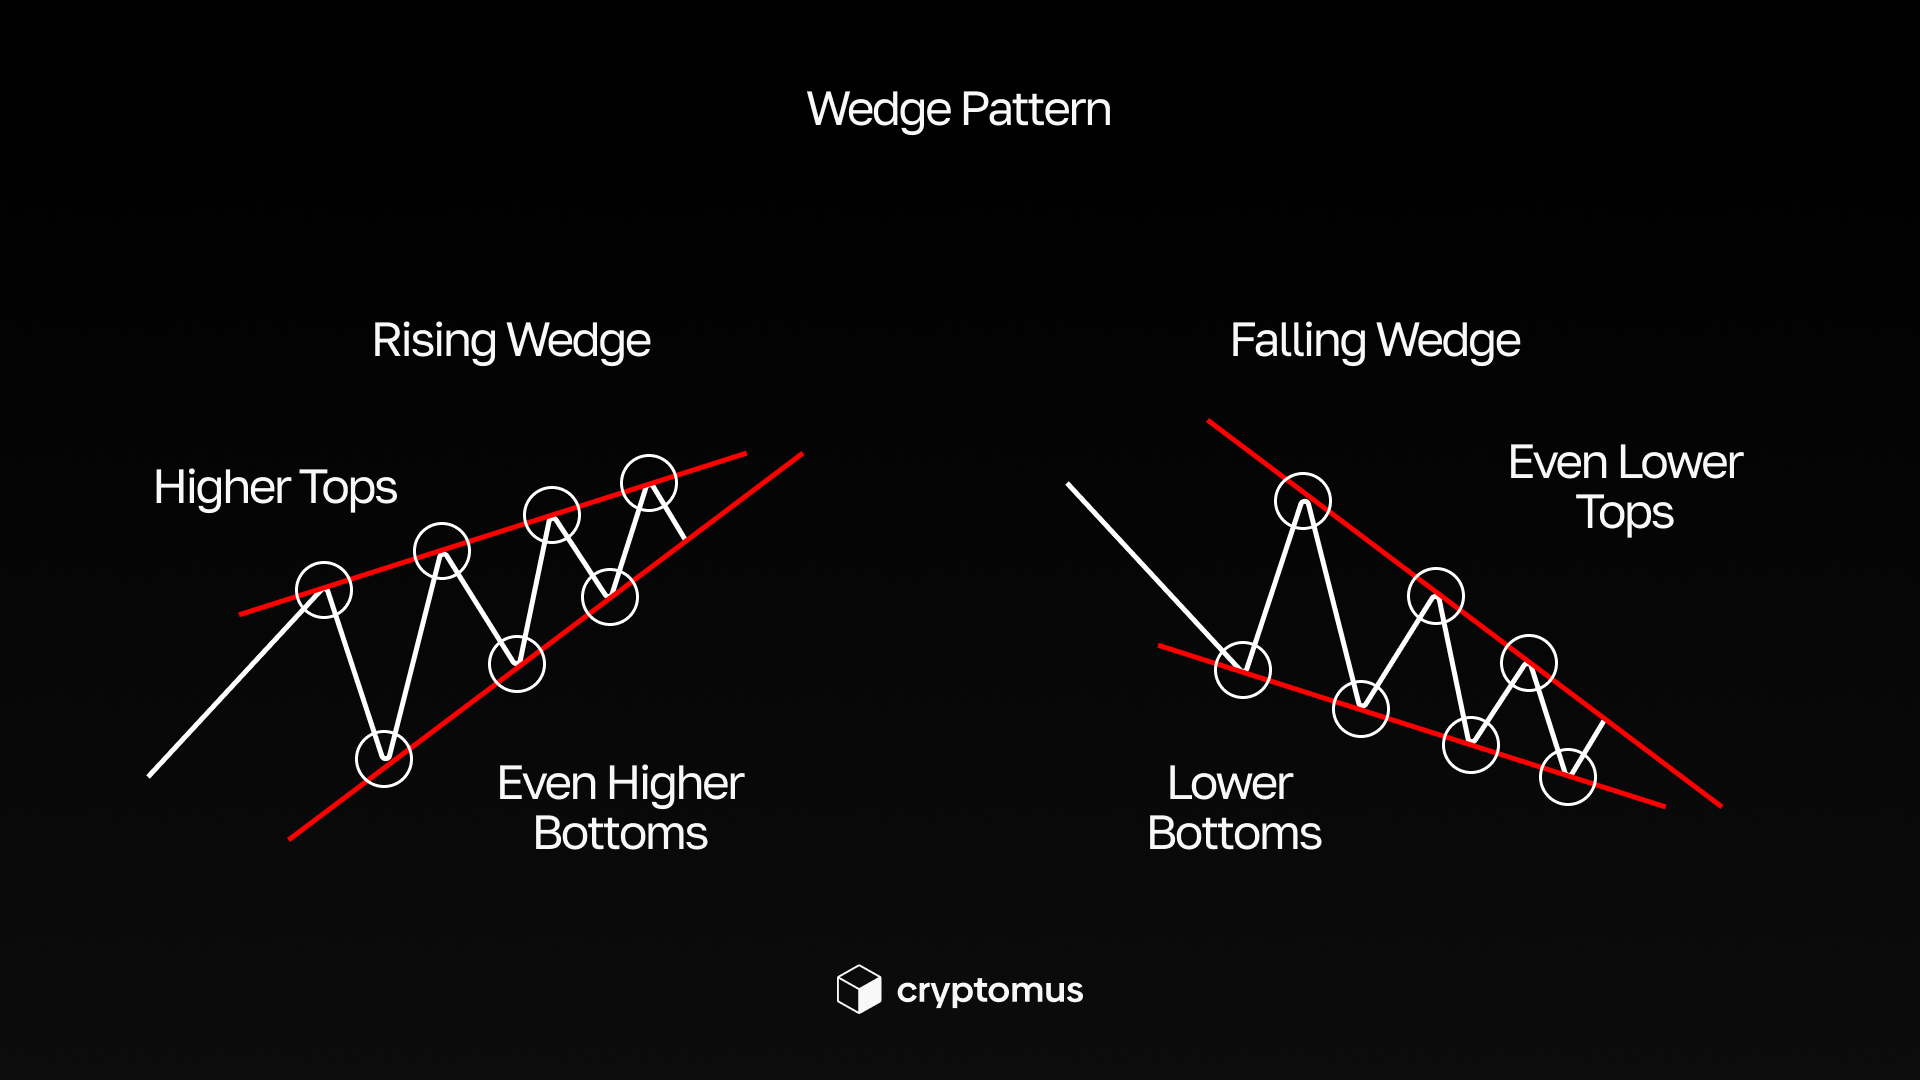
To spot a falling wedge, look for a downtrend that’s “running out of gas”. The price keeps making lower highs and lower lows, but they’re getting closer together, creating a cone that points down. That’s your falling wedge.
Now, for a rising wedge, flip that idea. The price is rising, but not as strongly. Highs are barely pushing up, lows are catching up, and the whole thing starts to narrow into a point facing up. It’s like the market’s hesitating—and that usually means a reversal’s soon to be coming into the picture.
Visually, it looks like this:
How to Use These Patterns in Trading?
Traders use falling and rising wedges to analyze market dynamics and identify potential opportunities to make a profit. Here's how these patterns help them:
-
Determining the entry point. A falling wedge means that you can buy only after a breakout upwards, and a rising wedge opens a selling entry after a breakout downwards. This protects against premature trades and helps you work only with a confirmed direction of movement.
-
Setting stop losses. The wedge narrows towards the end; this situation allows you to place your stop loss very close to the breakout level and reduce risks. If a falling wedge appears on the market, place your stop just below its lower line, and in a rising wedge, place your stop just above its upper line. This approach protects capital even when the signal is unsuccessful and improves the risk/reward ratio.
-
Determining price potential. The height of the wedge—the distance between its widest points—often shows how far the price can go after a breakout. If the wedge is high, the movement potential is greater.
-
Predicting market movements. The wedges help to understand when the market is “exhausted”. A falling wedge usually means the downtrend might be wrapping up, and a rebound could be on the way. And a rising wedge hints that the current uptrend is running out of steam, and a drop may be just around the corner. In both cases, wedges can help you spot good entry points—especially when the market’s about to shift or take a break.

Pros and Cons of Falling and Rising Wedges
For your comfort, we've compiled all the advantages and disadvantages of these patterns in one handy table:
| Aspect | Characteristics | |
|---|---|---|
| Pros | 1. They help you understand in advance that the current movement is beginning to weaken or rise. 2. They give a clear signal at the moment of breakout, when the direction becomes clear. 3. They allow you to set a short stop loss due to the narrowing of the pattern. 4. They help find entry points at a reversal or continuation. 5. The profit target is easily calculated based on the height of the wedge. | |
| Cons | 1. It's often difficult to distinguish a wedge from other similar patterns. 2. The breakout may turn out to be false, and the price may return back if the trading volume is too low to keep the positive momentum. 3. They can take a long time to form, and you have to wait for confirmation. 4. In a sideways market, the wedge often “breaks” and doesn't give a clear signal. 5. The height of the pattern is sometimes small, and the movement potential is limited. |

Have you ever encountered any of those patterns? Did you use them? How did it go? Share your experience below!


Simplify Your Crypto Journey
Want to store, send, accept, stake, or trade cryptocurrencies? With Cryptomus it's all possible — sign up and manage your cryptocurrency funds with our handy tools.
Get Started